Acceptance Rates at Top MBA Programs – Should They Inform Your Application Strategy?

Originally published on October 12, 2023. Updated with the 2023-2024 data on May 29, 2025.
As an applicant or prospective applicant to top MBA programs, you might be wondering about MBA program acceptance rates …and rightly so, applying to business school takes a ton of time and energy, you want to make sure all the effort pays off in the end!
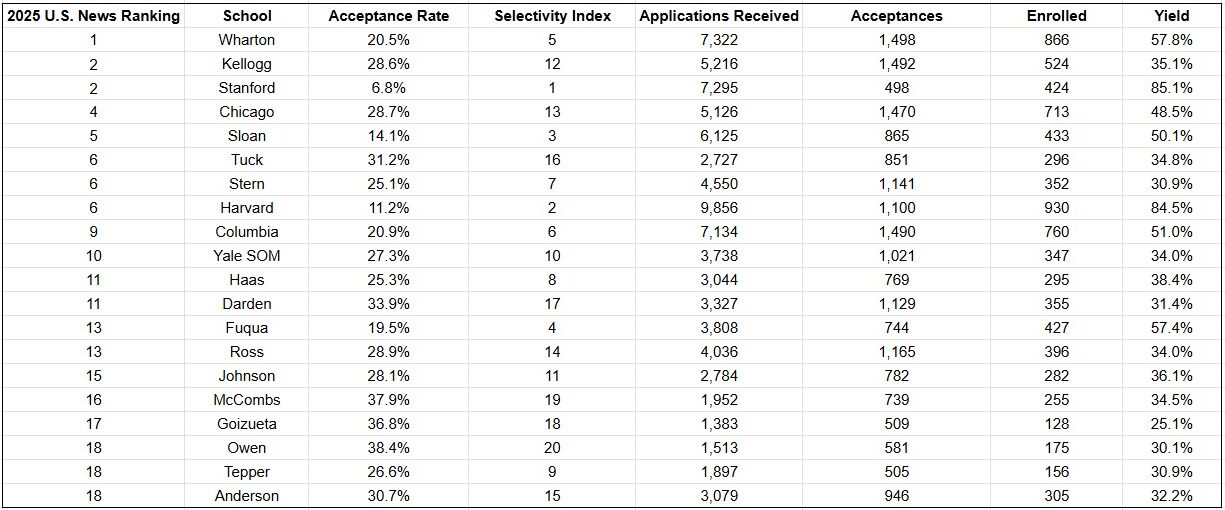
To simplify things for you, we’ve compiled a list of acceptance rates at top MBA programs for the class of 2026. Analyzing this data reveals some interesting and surprising insights about selectivity across schools and the variability of business school acceptance rates.

Stanford GSB is (Unsurprisingly) the Most Selective MBA Program
Many of you will not be surprised by the fact that Stanford GSB has the lowest acceptance rate of any U.S. MBA program. But just how selective it is might cause a few double takes.
The latest data shows that Stanford GSB accepts less than 7% of those who apply! That’s right, of the 7,295 who submitted applications, only 498 were accepted. Of note, however, is that this year marks a return to Stanford GSB’s historical acceptance rate (which has hovered at 6-7% for years) after it crept up to 8.4% in the previous application cycle.
For context, Harvard Business School’s acceptance rate was notably higher than Stanford’s in 2023-2024, at 11.2%. Of the 9,856 people who applied, 1,100 were admitted. Purely from a numbers standpoint, if you are considering adding a dream program to your list, HBS is statistically easier to get into (not that we’re recommending you decide where to apply solely based on this fact).
The Most Selective Program After Harvard and Stanford Is…
If you said Wharton (you know, H/S/W as the saying goes), you would be WRONG! There are actually two programs that are slightly less competitive than Harvard and Stanford but more competitive than Wharton – Sloan and Fuqua.
Why are these programs so selective, you may wonder? There are a few factors at play. The most readily apparent is class size – Wharton enrolls a huge class each year (~870 students) and both of these other programs are smaller (Sloan and Fuqua’s class hover around 430 students). There are simply fewer seats to fill, which is something to think about as you craft your list of target schools.
The second reason is a little more nuanced. Our experience is that Sloan and Fuqua have a heightened focus on fit with their unique cultures. All the top programs care about that nebulous concept of ‘fit’ but these two schools take it to the next level. If you are simply planning to blanket a selection of the top programs with applications to see ‘what sticks’, it is likely you will strike out at Sloan and Fuqua unless you really take the time to know them and what they look for in applicants.
An ancillary factor driving Sloan’s selectivity in particular is the number of applications it receives (>6,000, significantly more than other top 10 programs aside from H/S/W and Columbia). Sloan is also the only M7 school that has continued to offer a GMAT waiver option post-COVID, which could have increased application volume.
Two of the Highest Ranked MBA Programs Are Not as Selective as You May Think
A bright spot to note from the MBA acceptance rates data is that two of the highest ranked programs, Booth and Kellogg (ranked #4 and #2, respectively, by U.S. News & World Report), have acceptance rates of 28.7% and 28.6%, respectively. Yes, the competition is still fierce, but those percentages are roughly 4x Stanford’s acceptance rate and more than double that of Harvard’s.
While there are multiple reasons for this, the math is simple. Kellogg and Booth have substantial class sizes (500-700 students) but do not attract the same number of applicants as their more selective peers. It’s possible that people overlook Chicago in favor of the east and west coasts or are less familiar with the brand names of Kellogg’s and Booth’s parent universities. Whatever the driver, consider using this knowledge to your advantage when deciding where to apply.
If you need help narrowing your search or an expert opinion on where you will be competitive, feel free to reach out to our expert MBA admissions consultants today and get personalized guidance to make your application stand out.
Table of Acceptance Rates at Top MBA Programs

Katie is a passionate mentor and coach, helping her clients craft a unique, compelling story by leveraging her experience as a corporate executive, alumni interviewer, and campus recruiter. Before completing her MBA at Kellogg, Katie spent five years in banking where she learned practical finance skills as well as how to operate in a demanding, high pressure environment. She pursued an MBA in order to transition to an industry role where she could utilize her finance knowledge to drive change within an organization. Post-MBA, she worked in finance and strategy for a leading CPG firm, progressing to an executive role leading the finance function for a $2B business segment. Her experience managing diverse teams led to a passion for developing others. In addition to her day-to-day responsibilities, she led her firm’s MBA recruiting efforts and served as an alumni admissions interviewer for Kellogg.
Pingback: Round 1 vs. Round 2 | Vantage Point MBA
July 25, 2024 11:37 pmPingback: My Stanford GSB Interview Experience: Questions To Expect and How To Prepare
September 26, 2024 7:00 pmPingback: The HBS Interview – What to Expect, How to Prepare & Sample Questions | Vantage Point MBA
October 3, 2024 7:28 pmPingback: How to Handle MBA Admissions Rejection and Reapply Stronger
December 10, 2025 3:36 pm